Note
Go to the end to download the full example code
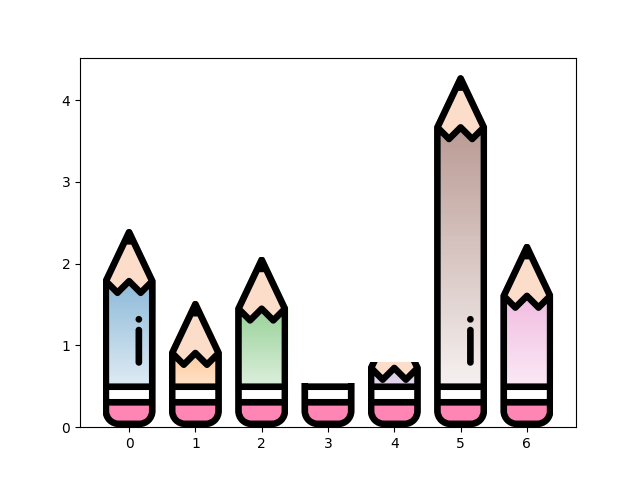
Another Demo of SVG bar chart
from matplotlib.transforms import Affine2D

xmlstring = b"""<?xml version="1.0" encoding="iso-8859-1"?>
<!-- Uploaded to: SVG Repo, www.svgrepo.com, Generator: SVG Repo Mixer Tools -->
<svg version="1.1" id="Layer_1" xmlns="http://www.w3.org/2000/svg" xmlns:xlink="http://www.w3.org/1999/xlink"
     viewBox="0 0 512 512" xml:space="preserve">
<path style="fill:#FFAF00;" d="M67.584,341.269L386.512,22.343c15.856-15.858,41.565-15.858,57.421-0.001l45.726,45.726
    c15.857,15.856,15.857,41.565-0.001,57.422L170.732,444.417L67.584,341.269z"/>
<path style="fill:#FCDDC9;" d="M10.449,501.551l57.135-160.282h51.574l-0.001,51.572l51.574,0.001v51.574L10.449,501.551z"/>
<rect x="328.552" y="85.994" transform="matrix(-0.7071 -0.7071 0.7071 -0.7071 607.2446 472.522)" style="fill:#FFFFFF;" width="145.866" height="49.004"/>
<path style="fill:#FF85B4;" d="M489.659,68.068l-45.726-45.726c-15.856-15.857-41.565-15.857-57.421,0.001l-14.789,14.788
    l-4.473,4.473L470.397,144.75l19.261-19.261C505.515,109.633,505.515,83.923,489.659,68.068z"/>
<path d="M212.553,266.449c-2.679,0-5.358-1.024-7.399-3.071c-4.074-4.087-4.065-10.703,0.022-14.777l0.172-0.172
    c4.087-4.075,10.702-4.066,14.777,0.022c4.074,4.087,4.065,10.703-0.022,14.777l-0.173,0.172
    C217.892,265.432,215.222,266.449,212.553,266.449z"/>
<path d="M236.629,242.372c-2.674,0-5.349-1.02-7.388-3.061c-4.08-4.08-4.08-10.697,0-14.778l71.766-71.766
    c4.08-4.08,10.697-4.08,14.778,0c4.08,4.08,4.08,10.697,0,14.778l-71.766,71.766C241.977,241.353,239.303,242.372,236.629,242.372z"
    />
<path d="M512,96.778c0-13.637-5.31-26.458-14.954-36.1l-45.725-45.725C441.679,5.31,428.86,0,415.223,0
    c-13.637,0.001-26.458,5.311-36.099,14.954L60.196,333.88c0.001,0.001,0.003,0.002,0.005,0.002c-1.074,1.073-1.927,2.384-2.46,3.878
    L0.607,498.042c-1.355,3.801-0.4,8.044,2.453,10.897C5.054,510.933,7.725,512,10.451,512c1.176,0,2.361-0.199,3.507-0.607
    l160.282-57.134c1.493-0.532,2.803-1.384,3.877-2.458c0.001,0.001,0.002,0.002,0.004,0.004l318.925-318.928
    C506.689,123.235,512,110.415,512,96.778z M367.249,56.382l88.369,88.369l-19.874,19.875l-88.369-88.369l18.965-18.965
    L367.249,56.382z M160.283,437.049L42.701,478.962l-9.662-9.662l41.914-117.581h33.758l-0.001,41.123c0,2.771,1.1,5.428,3.061,7.388
    c1.96,1.959,4.617,3.06,7.388,3.06l41.125,0.001V437.049z M170.732,382.394l-41.125-0.001l0.001-41.123
    c0-2.771-1.101-5.429-3.061-7.388c-1.959-1.959-4.617-3.061-7.388-3.061H92.811L332.597,91.034l88.369,88.369L181.181,419.191
    v-26.348C181.181,387.072,176.503,382.394,170.732,382.394z M482.268,118.101l-11.873,11.873l-88.369-88.369L393.9,29.73
    c5.696-5.696,13.268-8.833,21.322-8.833c8.054,0,15.626,3.137,21.322,8.833l45.726,45.726c5.695,5.696,8.831,13.267,8.831,21.322
    S487.965,112.406,482.268,118.101z"/>
</svg>
"""

from mpl_simple_svg_parser import SVGMplPathIterator, get_paths_extents
from mpl_pe_fancy_bar import (
    PathsStretcher,
    # BarTransformFromFunc,
    BarToMultiplePaths,
)
from mpl_pe_fancy_bar.paths_stretcher import (
    get_normalizing_transform,
    show_paths_with_gc_prop,
    show_paths_with_patch_prop
)


import matplotlib.pyplot as plt

if False:
    svg = SVGMplPathIterator(xmlstring)
    paths = list(svg.iter_mpl_path_patch_prop())

    fig, ax = plt.subplots(1, 1, num=1, clear=True)
    ax.set_aspect(True)
    show_paths_with_patch_prop(ax, paths)


    tr_rotate = Affine2D().rotate_deg(-135)
    paths = [(tr_rotate.transform_path(p), _) for (p, _) in paths]
    fig, ax = plt.subplots(1, 1, num=2, clear=True)
    ax.set_aspect(True)
    show_paths_with_patch_prop(ax, paths, show_i=True)

    bb = get_paths_extents([p for p, _ in paths])
    tr, height = get_normalizing_transform(bb)
    paths = [(tr.transform_path(p), _) for (p, _) in paths]

    fig, ax = plt.subplots(1, 1, num=2, clear=True)
    ax.set_aspect(True)
    show_paths_with_patch_prop(ax, paths, show_i=True)

    plt.show()


def get_pencil_drawer():

    svg = SVGMplPathIterator(xmlstring)
    paths = list(svg.iter_mpl_path_patch_prop())
    tr_rotate = Affine2D().rotate_deg(-135)
    paths = [(tr_rotate.transform_path(p), _) for (p, _) in paths]
    bb = get_paths_extents([p for p, _ in paths])
    tr, height = get_normalizing_transform(bb)
    paths = [(tr.transform_path(p), _) for (p, _) in paths]

    def get_color(i, p, fc, ec, fc_new, ec_new):
        if i in [0]:
            return fc_new, ec

        return fc, ec

    # we use height of the box without the ribbon part at the top.
    ribbonbox_drawer = PathsStretcher(paths[:-3] + paths[-1:], height, y_thresh=2.7,
                                    height_lim=2.1,
                                    fn_get_color=get_color, low_height_mode=None,
                                    paths_toggle=paths[-3:-1], height_toggle=3.5)


    return ribbonbox_drawer

if False:
    ribbonbox_drawer = get_pencil_drawer()
    paths = ribbonbox_drawer(3.6, "y")

    fig, ax = plt.subplots(1, 1, num=5, clear=True)
    ax.set_aspect(True)
    show_paths_with_gc_prop(ax, paths)

    plt.show()

if True:

    import numpy as np
    import matplotlib.pyplot as plt
    import mpl_visual_context.patheffects as pe

    np.random.seed(19680)

    # Example data
    n = 7
    x_pos = np.arange(n)
    performance = 5 * np.random.rand(n)
    colors = [f"C{i}" for i in range(n)]

    fig, ax = plt.subplots(1, 1, num=6, clear=True)

    bars = ax.bar(x_pos, performance, align='center', alpha=0.7, color=colors)

    drawer = get_pencil_drawer()

    pe1 = BarToMultiplePaths(drawer)
    for p, perf in zip(bars, performance):
        p.set_path_effects([pe1.path_only() | pe.ClipRect(ax, top=perf) | pe.AlphaGradient("up"),
                            pe.ClipPathSelf() | pe.FillColor(None) | pe1,
                            ])

    plt.show()
Total running time of the script: (0 minutes 0.215 seconds)