Note
Go to the end to download the full example code
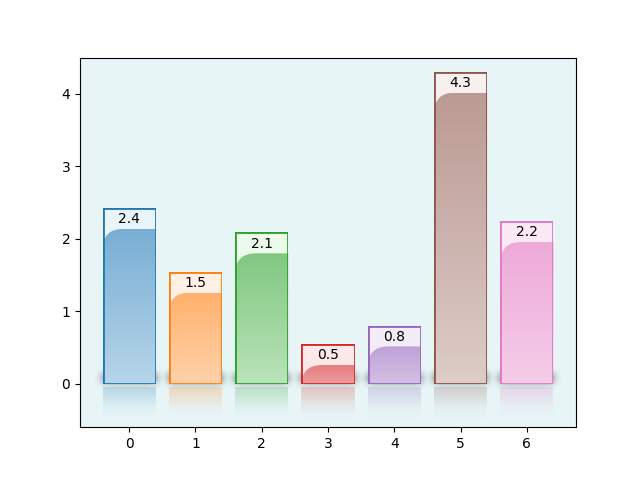
Barchart with modified path
from mpl_visual_context.patheffects_image_box import AlphaGradient
from mpl_visual_context.patheffects import RoundCorner
import numpy as np
import matplotlib.pyplot as plt
from matplotlib.patheffects import Normal

# Fixing random state for reproducibility
np.random.seed(19680)

# Example data
n = 7
x_pos = np.arange(n)
performance = 5 * np.random.rand(n)
colors = [f"C{i}" for i in range(n)]

fig, ax = plt.subplots(1, 1, num=1, clear=True)

import mpl_visual_context.patheffects as pe
import mpl_visual_context.image_effect as ie

from mpl_visual_context.patheffects_image_effect import (ImageClipboard,
                                                         ClipboardPasteArtist,
                                                         ReflectionArtist)
ax.patch.set(fc="powderblue", alpha=0.3)
bars = ax.bar(x_pos, performance, align='center', alpha=0.7, color=colors)

ic = ImageClipboard()
pe1 = [
    pe.StrokeColor("k") | pe.GCModify(alpha=1, linewidth=4) | pe.Affine().scale(1, 0) |
    pe.ImageEffect(ie.Pad(10) | ie.Fill("k") | ie.GaussianBlur(3) | ie.Offset(0, 6)), # to make shadow at the bottom.
    pe.GCModify(alpha=1) | pe.HLSModify(l=0.95),
    pe.GCModify(alpha=1, linewidth=2) | pe.ClipPathSelf() | pe.StrokeColorFromFillColor() | pe.StrokeOnly(),
    pe.Offset(0, -15) | RoundCorner(15, i_selector=lambda i: i in [3])
    | pe.ClipRect(ax, bottom=0, coords="data") | pe.AlphaGradient("0.3 ^ 0.8"),
    # pe.Affine().scale(1, -1) | pe.Offset(0, 15) | RoundCorner(15, i_selector=lambda i: i in [3])
    # | pe.ClipRect(ax, top=0, coords="data") | ic.copy(),
    pe.Affine().scale(1, -1) | ic.copy()
]

a = ReflectionArtist(ic, None, image_effect=ie.Offset(0, -3),
                     alpha_default=0.3,
                     alpha_dist_sigma=12)
# a.set_clip_box(ax.bbox)
a.set_zorder(2)
ax.add_artist(a)

for p, perf1 in zip(bars, performance):
    p.set_path_effects(pe1)
    ax.annotate(f"{perf1:.1f}",
                (0.5, 1), xycoords=p,
                xytext=(0, -3), textcoords="offset points",
                ha="center", va="top")

ax.set_ylim(-0.6, 4.5)

plt.show()
Total running time of the script: (0 minutes 0.167 seconds)