Note
Go to the end to download the full example code
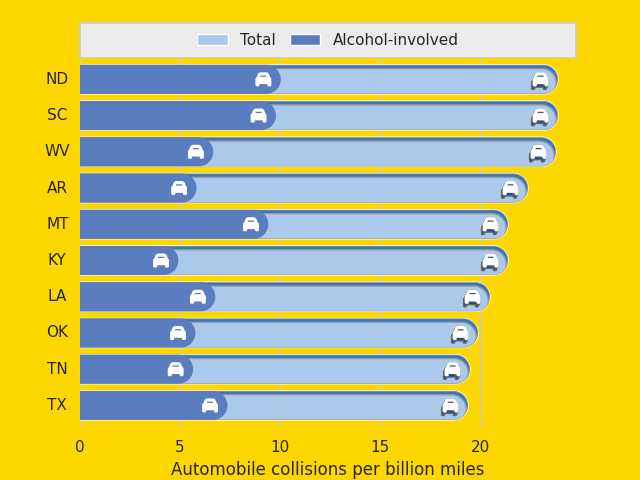
Horizontal bar chart
import numpy as np
import seaborn as sns
import matplotlib.pyplot as plt
sns.set_theme(style="whitegrid")

# Initialize the matplotlib figure
fig, ax = plt.subplots(num=1, clear=True)

# Load the example car crash dataset
crashes = sns.load_dataset("car_crashes").sort_values("total", ascending=False).iloc[:10]

# Plot the total crashes
sns.set_color_codes("pastel")
sns.barplot(x="total", y="abbrev", data=crashes,
            label="Total", color="b")

# Plot the crashes where alcohol was involved
sns.set_color_codes("muted")
sns.barplot(x="alcohol", y="abbrev", data=crashes,
            label="Alcohol-involved", color="b")

# Add a legend and informative axis label
ax.legend(ncol=2, loc="lower right", frameon=True,
          bbox_to_anchor=[1, 1])
ax.set(xlim=(0, 24.8),
       ylim=(9.6, -0.6),
       ylabel="",
       xlabel="Automobile collisions per billion miles")
sns.despine(left=True, bottom=True)


import mpl_visual_context.patheffects as pe
from mpl_pe_fancy_bar import BarTransformBase, BarToRoundBar
from matplotlib.path import Path

from matplotlib.transforms import Affine2D
from svgpath2mpl import parse_path
s="M135.2 117.4L109.1 192H402.9l-26.1-74.6C372.3 104.6 360.2 96 346.6 96H165.4c-13.6 0-25.7 8.6-30.2 21.4zM39.6 196.8L74.8 96.3C88.3 57.8 124.6 32 165.4 32H346.6c40.8 0 77.1 25.8 90.6 64.3l35.2 100.5c23.2 9.6 39.6 32.5 39.6 59.2V400v48c0 17.7-14.3 32-32 32H448c-17.7 0-32-14.3-32-32V400H96v48c0 17.7-14.3 32-32 32H32c-17.7 0-32-14.3-32-32V400 256c0-26.7 16.4-49.6 39.6-59.2zM128 288a32 32 0 1 0 -64 0 32 32 0 1 0 64 0zm288 32a32 32 0 1 0 0-64 32 32 0 1 0 0 64z"
icon = parse_path(s)

class CustomBar(BarTransformBase):
    def __init__(self, radius=0.3, dh=0.5, orientation="vertical"):
        super().__init__(orientation)
        self._radius = radius
        self._dh = dh

    def _get_surface(self, h):
        v0 = Affine2D().rotate_deg(90).transform(icon.vertices / 512. - 0.5)
        vertices = v0 * self._radius + [0, h-self._dh]
        circle = Path(vertices=vertices, codes=icon.codes)
        return circle

from mpl_visual_context.patheffects_shadow import ShadowPath

cb1 = BarToRoundBar(orientation="horizontal", dh=0.5)
cb2 = CustomBar(orientation="horizontal", radius=0.5, dh=0.6)
shadow = ShadowPath(115, 3)
pe1 = [
    cb1,
    cb1 | pe.ClipPathSelf() | shadow | pe.HLSModify(l="60%"),
    cb2 | shadow | pe.HLSModify(l="40%"),
    cb2 | pe.FillColor("w")
]
for p in ax.containers[0]:
    p.set_path_effects(pe1)
pe1 = [
    cb1 | pe.FillOnly(),
    cb2 | pe.FillColor("w")
]
for p in ax.containers[1]:
    p.set_path_effects(pe1)

from mpl_visual_context.axes_panel import InsetDivider
from mpl_visual_context.axes_panel import add_panel

divider = InsetDivider(ax)

panel = add_panel(divider, "left", "ticklabels", pad=0.0, path_effects=[])
for sp in panel.spines.values():
    sp.set_visible(False)

fc = "gold"
fig.patch.set_fc(fc)
ax.patch.set_fc(fc)
panel.patch.set_visible(False)

from mpl_visual_context.legend_helper import (
    extract_offset_boxes_from_legend,
)
from matplotlib.offsetbox import HPacker
from matplotlib.offsetbox import AnchoredOffsetbox

leg_title, oblist = extract_offset_boxes_from_legend(ax.legend_)

pack = HPacker(pad=0.0, sep=10, children=oblist)
box = AnchoredOffsetbox("center", child=pack, pad=0, frameon=False)

legend_panel = add_panel(divider, "top", "empty", pad=0.0)
legend_panel.add_artist(box)
legend_panel.add_to_extent_list(box)
legend_panel.grid(False)

ax.legend_.remove()


plt.show()
Total running time of the script: (0 minutes 1.222 seconds)